Navigate offers a range of reporting features to gather care unit data and student information over a certain period of time. Not everyone has access to all of these reports, so please keep in mind that access may vary. These can all be found under the "Reporting" icon on the left-hand side toolbar.
Note: The difference between a report and an advanced search is that a report can most often only be run for a certain period of time, such as a specific semester and includes pre-made columns of information that an advanced search does not have.
Note: The advanced search and reports can only accurately gather data for the past 2 years. It is NOT for gathering historical data. Navigate does house some historical data within "Analytics" and "Institutional Reports" . Access to these can be requested on a case by case basis.
Pre-Made Reports (NEW)
Navigate now has the ability to generate pre-made reports that are accessible via a link. To utilize these pre-made reports, first login to Navigate. Then, simply select the link to the report you are interested in below and edit the existing example to reflect the criteria you are interested in. Note: Not everyone has access to all reports, so report access may vary. If you have any questions please email navigatehelp@southernct.edu.
The Check-ins report gives you information about check-ins and related data, including locations and check-out information, within the selected date range. Check-Ins capture any time a student swipes in at a kiosk.
For example filters that are pre-made and can be auto-filled into Navigate, first login to Navigate and then click HERE. Simply adjust the care unit, location, service and date range to your desired criteria and hit Run Report.
How to Manually Create a Check-Ins Report
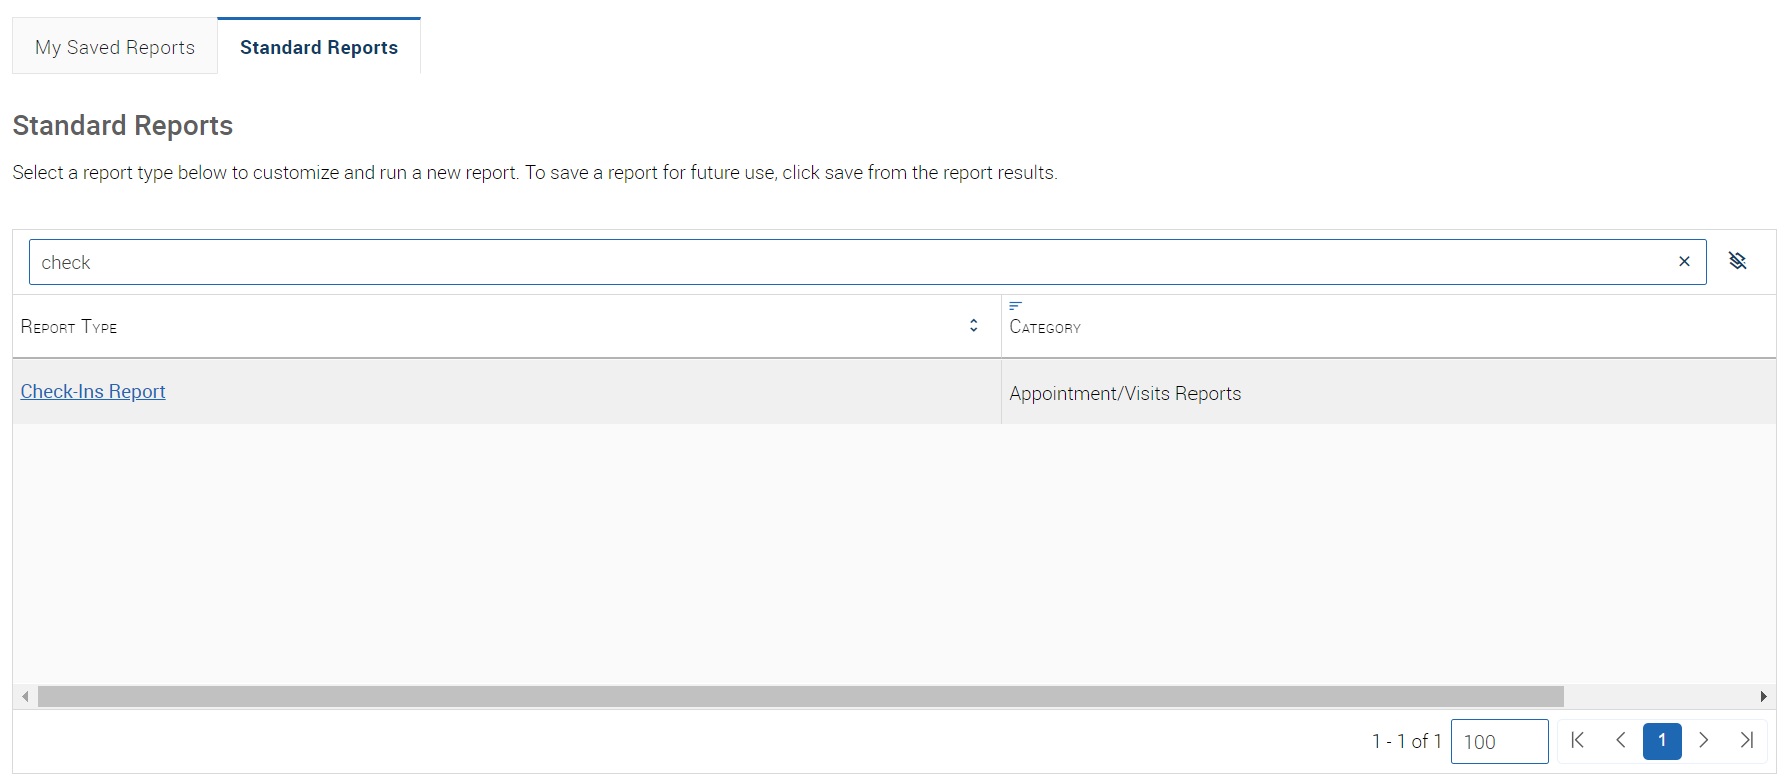
To create a Check-ins report, simply navigate to the Reporting page by selecting the icon that looks like an excel sheet with a magnifying glass from the left-side toolbar. From here, under "Standard Reports" select "Check-ins". You will then see the following screen.
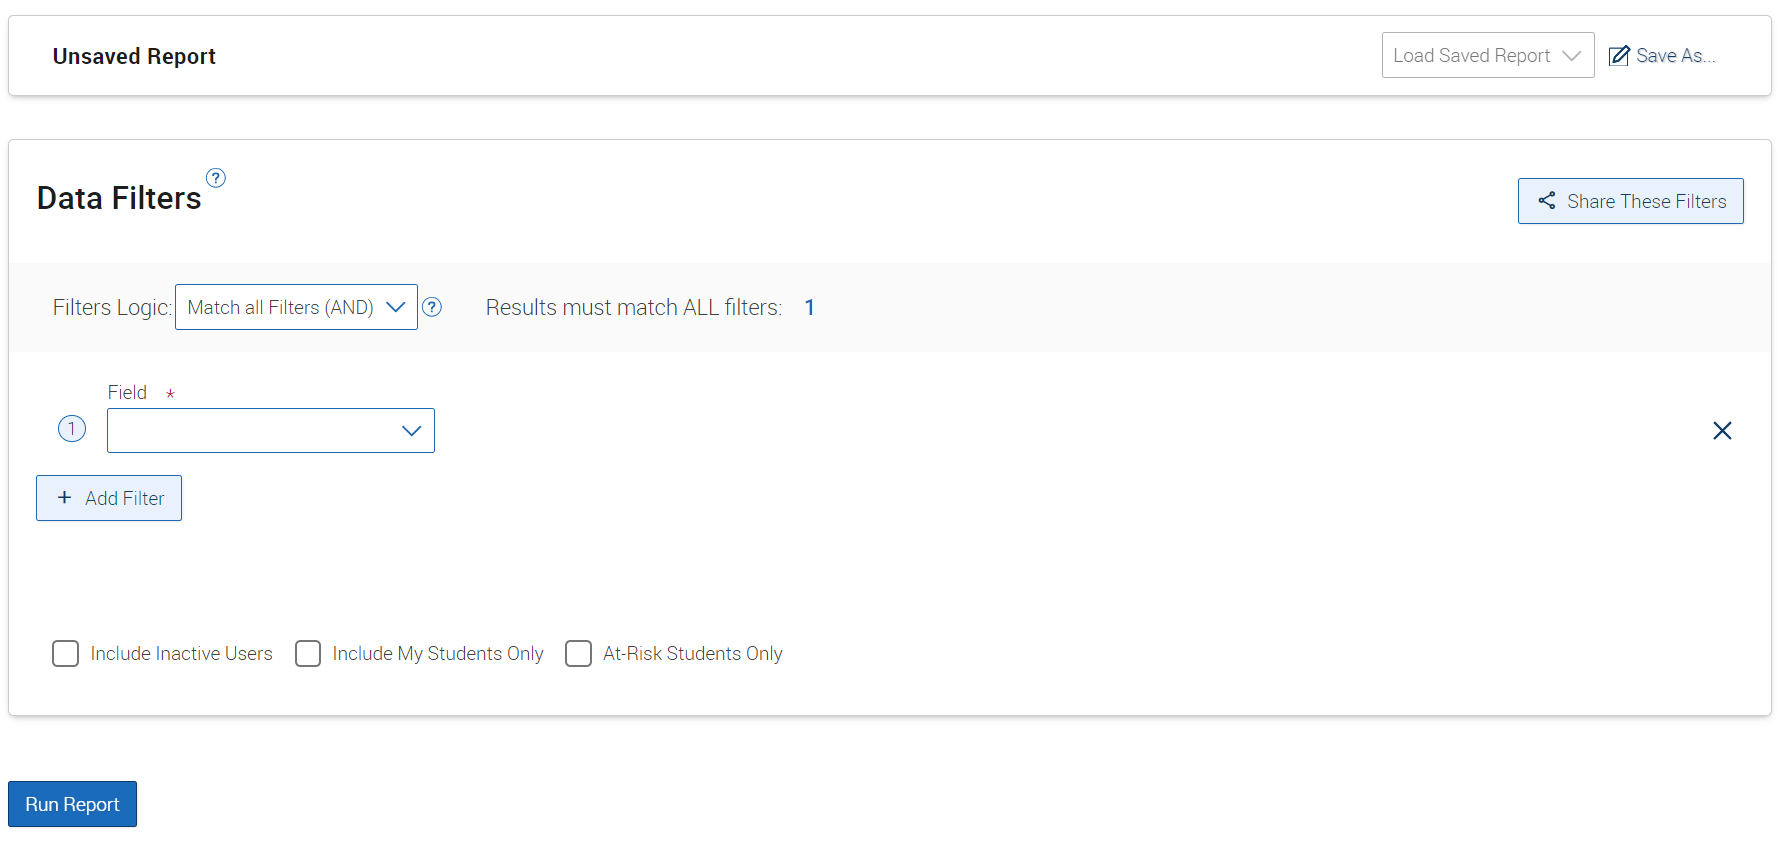
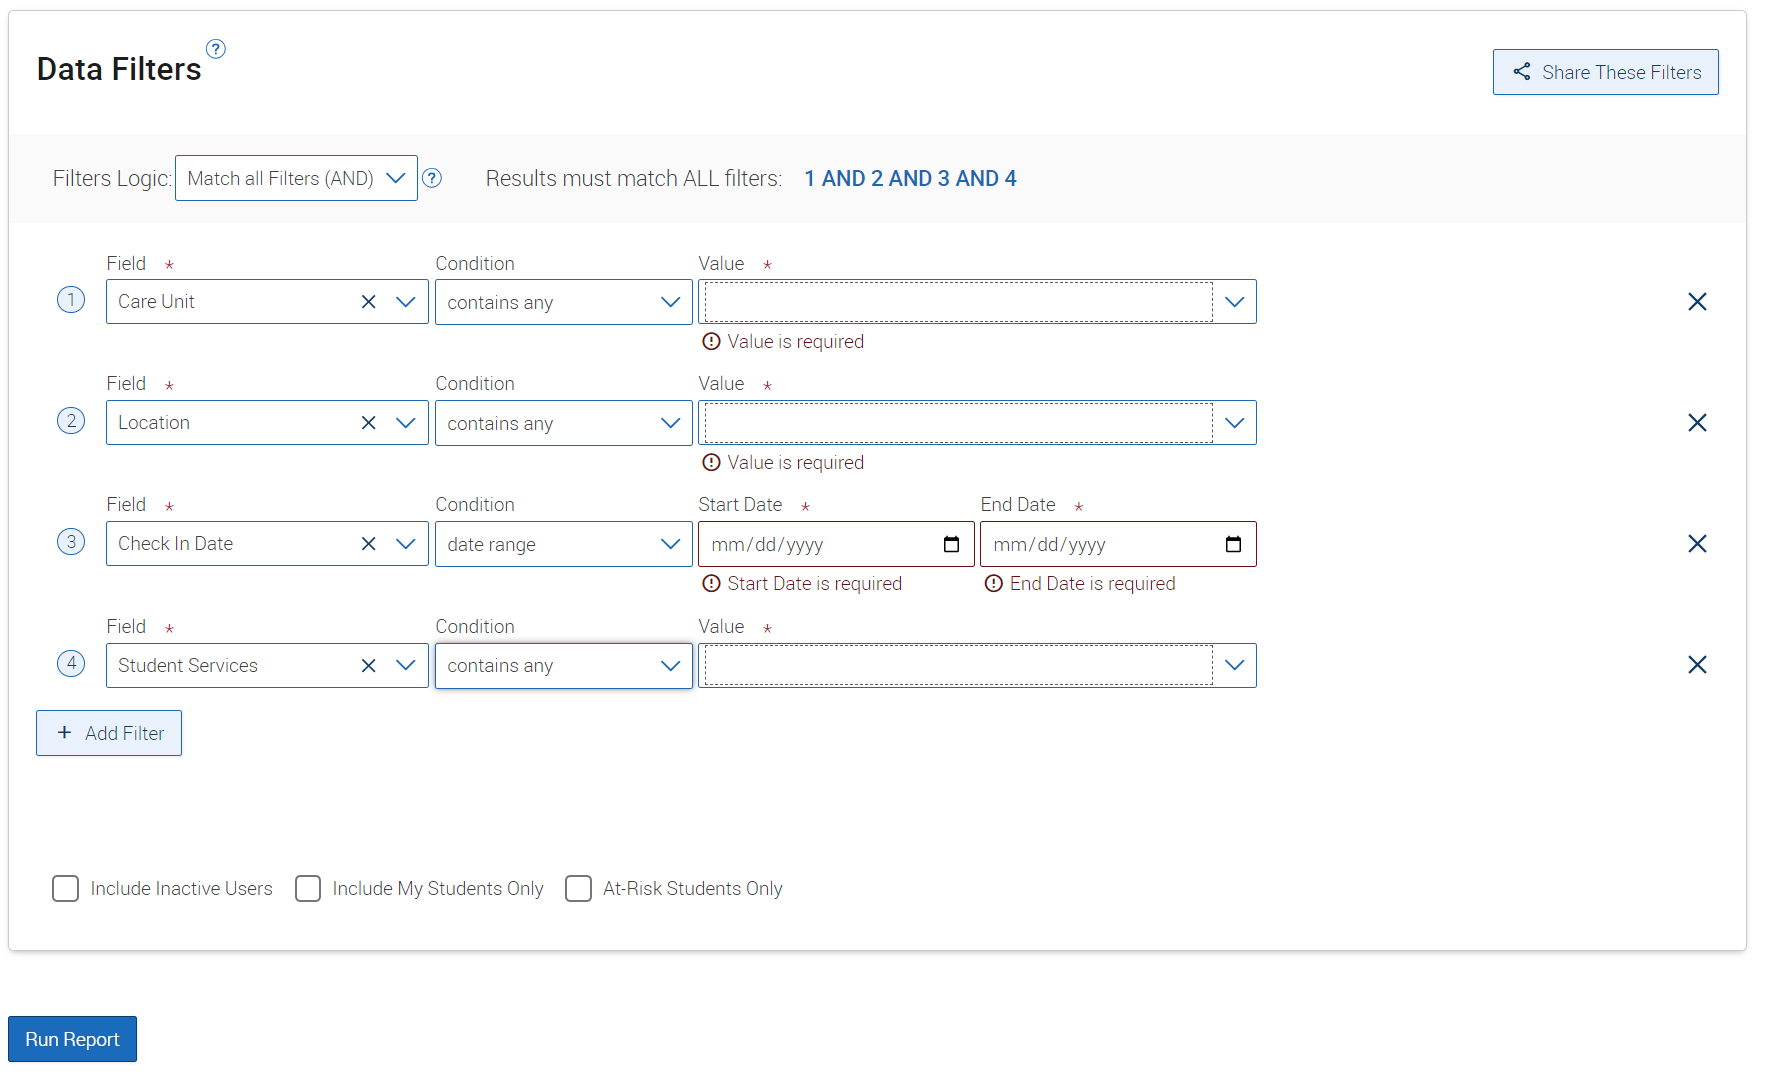
Now you can enter your desired search criteria. I.e. your care unit, location and date range. You also have the ability to filter the results further by using Student Area of Study, Information, Performance Data or Term Data filters. Note that for the date range you should use "Check-In Date". This allows you to look for focused groups of students that have had appointments in a certain location. Note that you can type into the "Field" to search for any field you'd like to filter by. Below is an example of how you can filter by care unit, location and service for a specific date range.
The Appointments report gives you information about all Appointments scheduled through Navigate as well as drop-in appointments that have a summary report. It includes the location, care unit, purpose, date and organizer of the appointment among other information. You can also filter it by a specific Appointment Campaign.
For example filters that are pre-made and can be auto-filled into Navigate, first login to Navigate and then click HERE. Simply adjust the care unit, location, service and date range to your desired criteria and hit Run Report.
How to Manually Create an Appointments Report
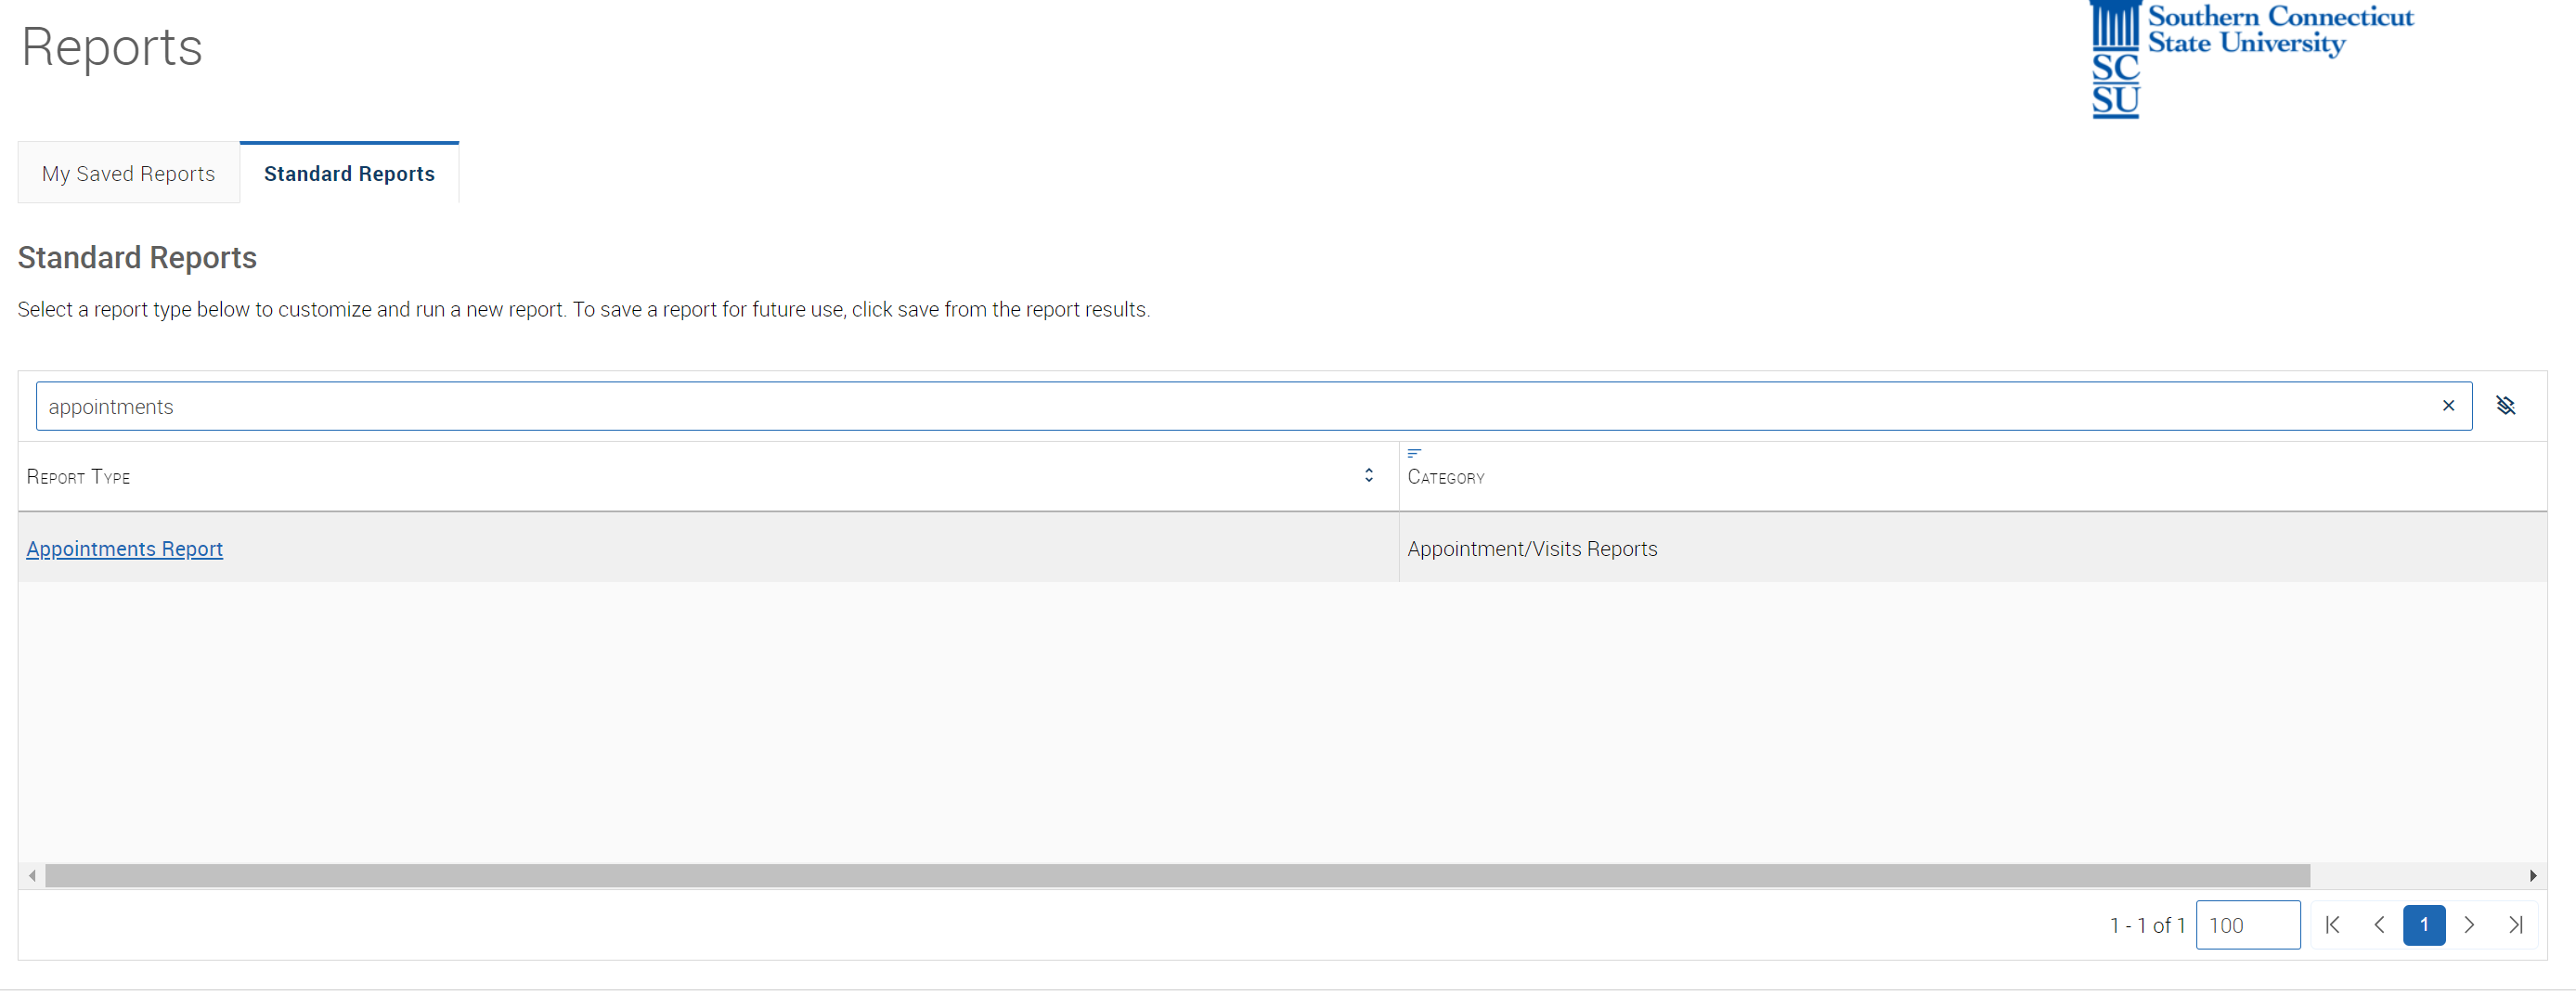
To create an Appointments report, simply navigate to the Reporting page by selecting the icon that looks like an excel sheet with a magnifying glass from the left-side toolbar. From here, under "Standard Reports" select "Appointments Report". You will then see the following screens.
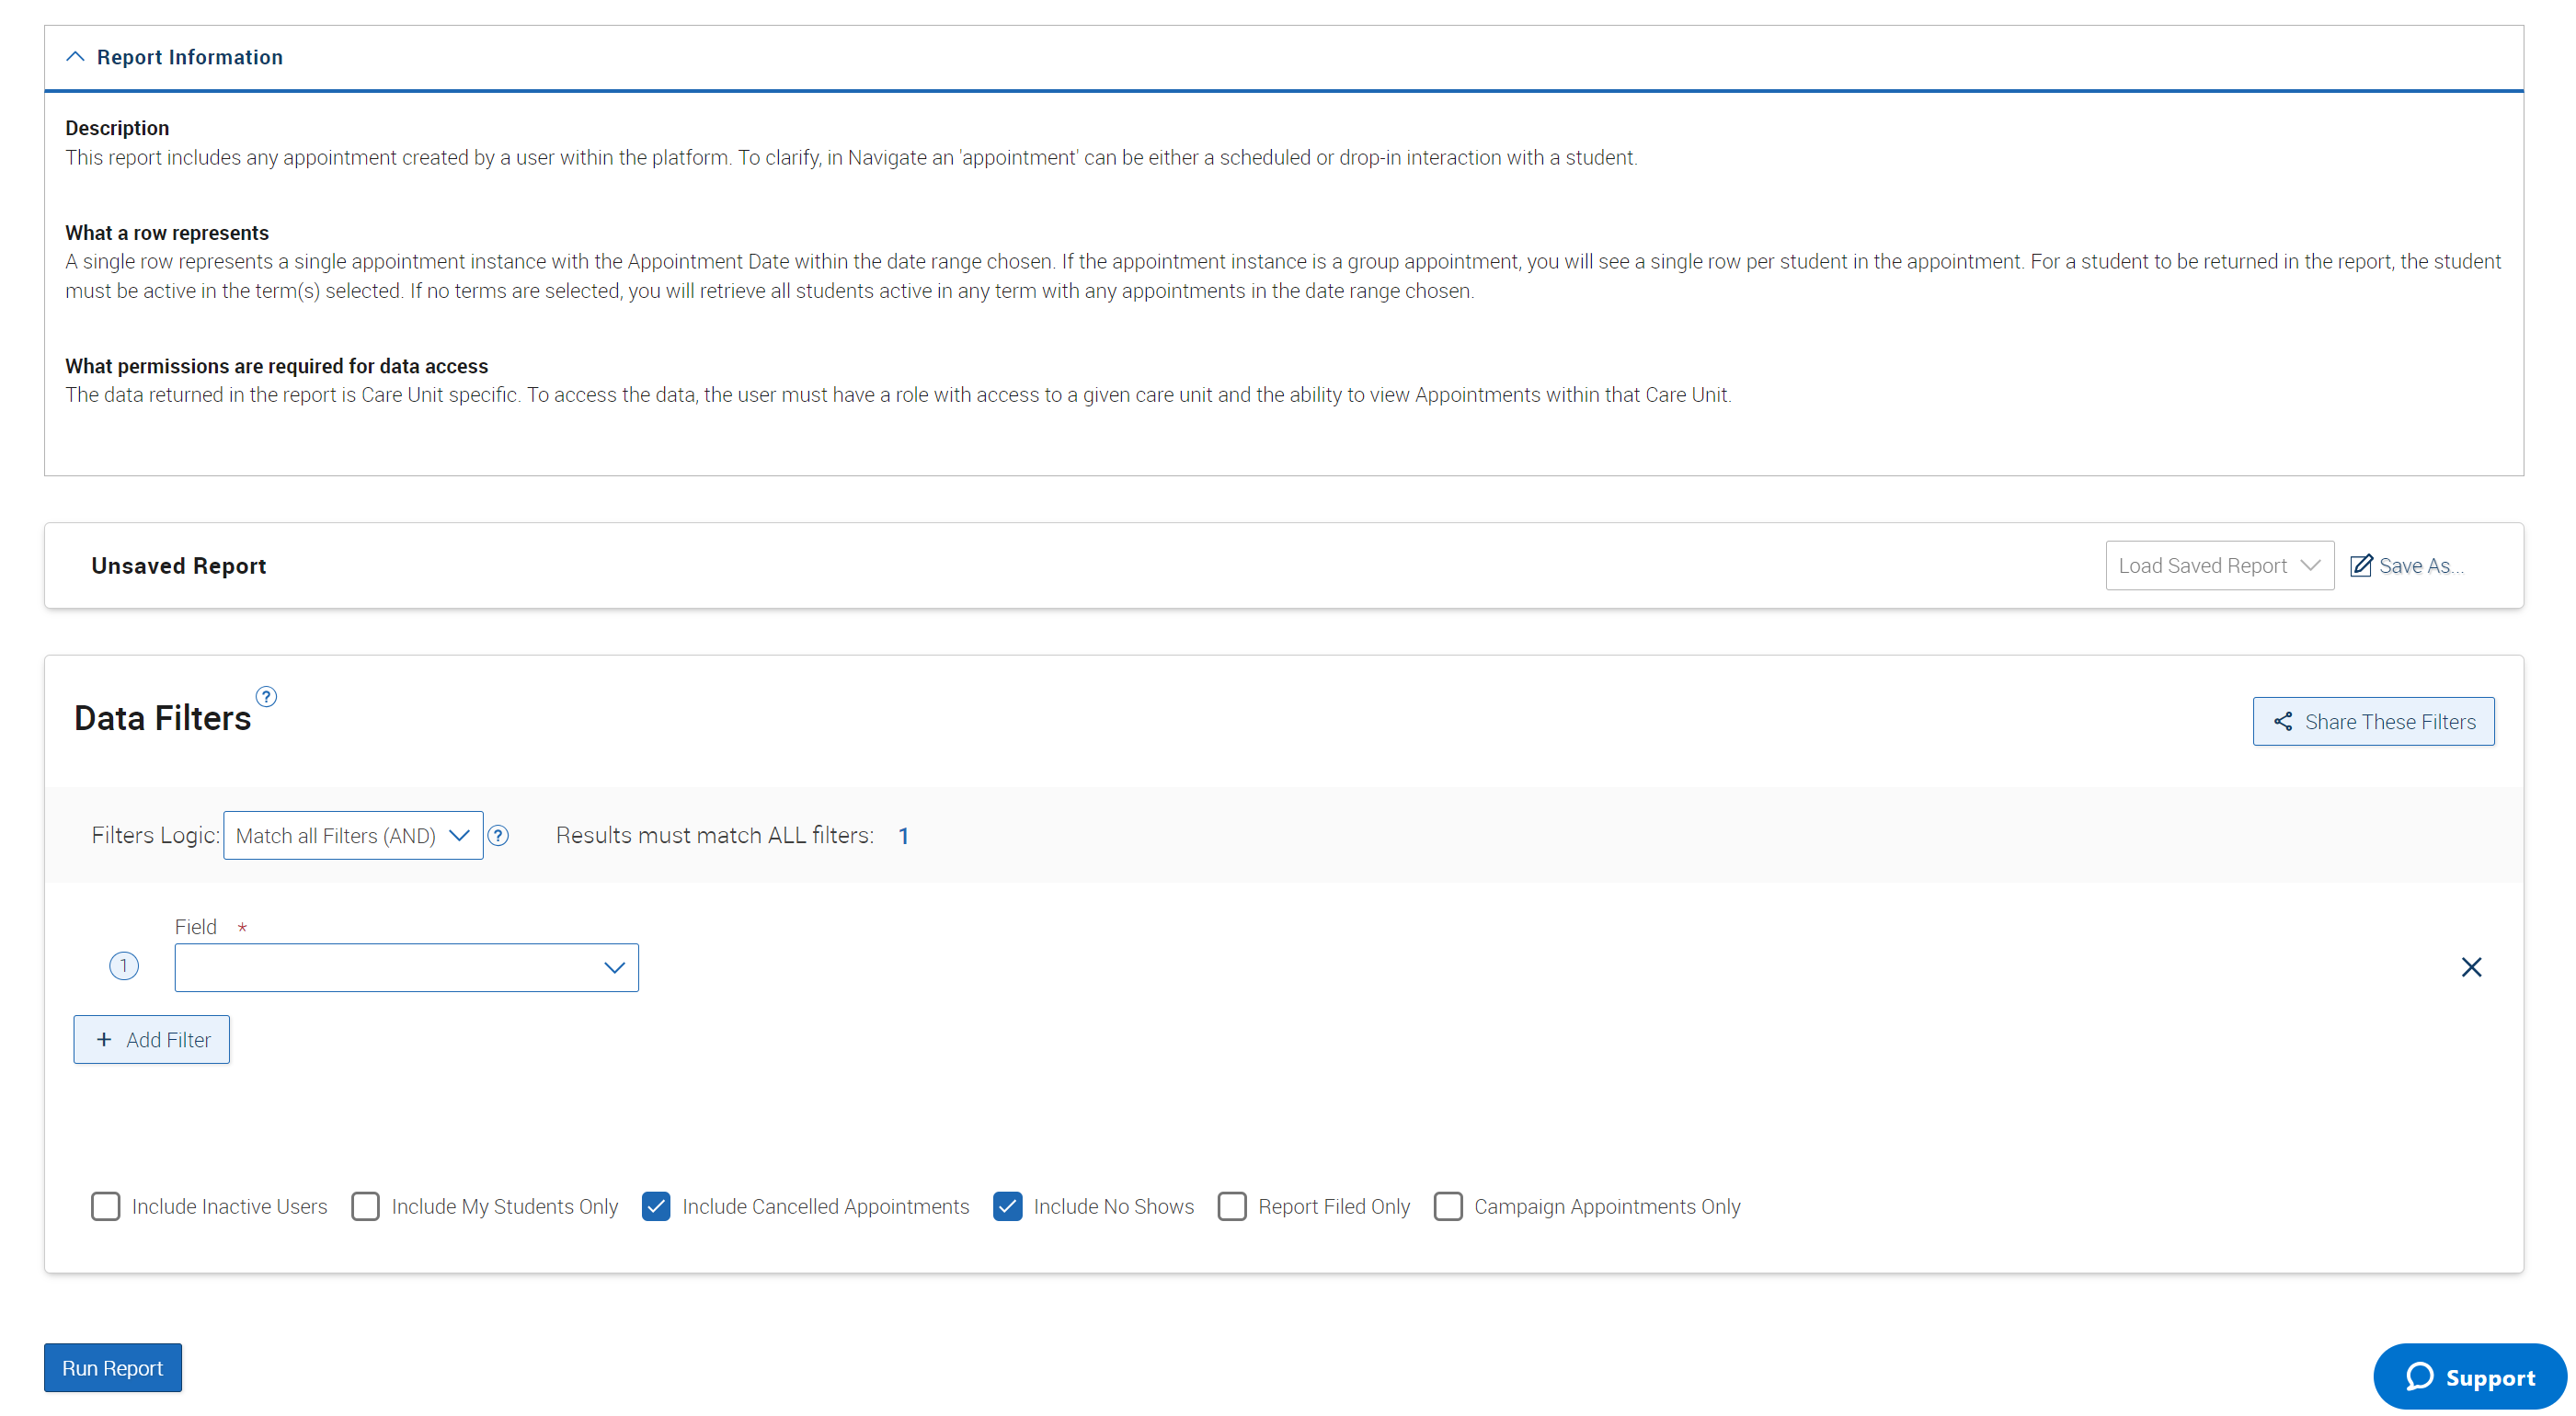
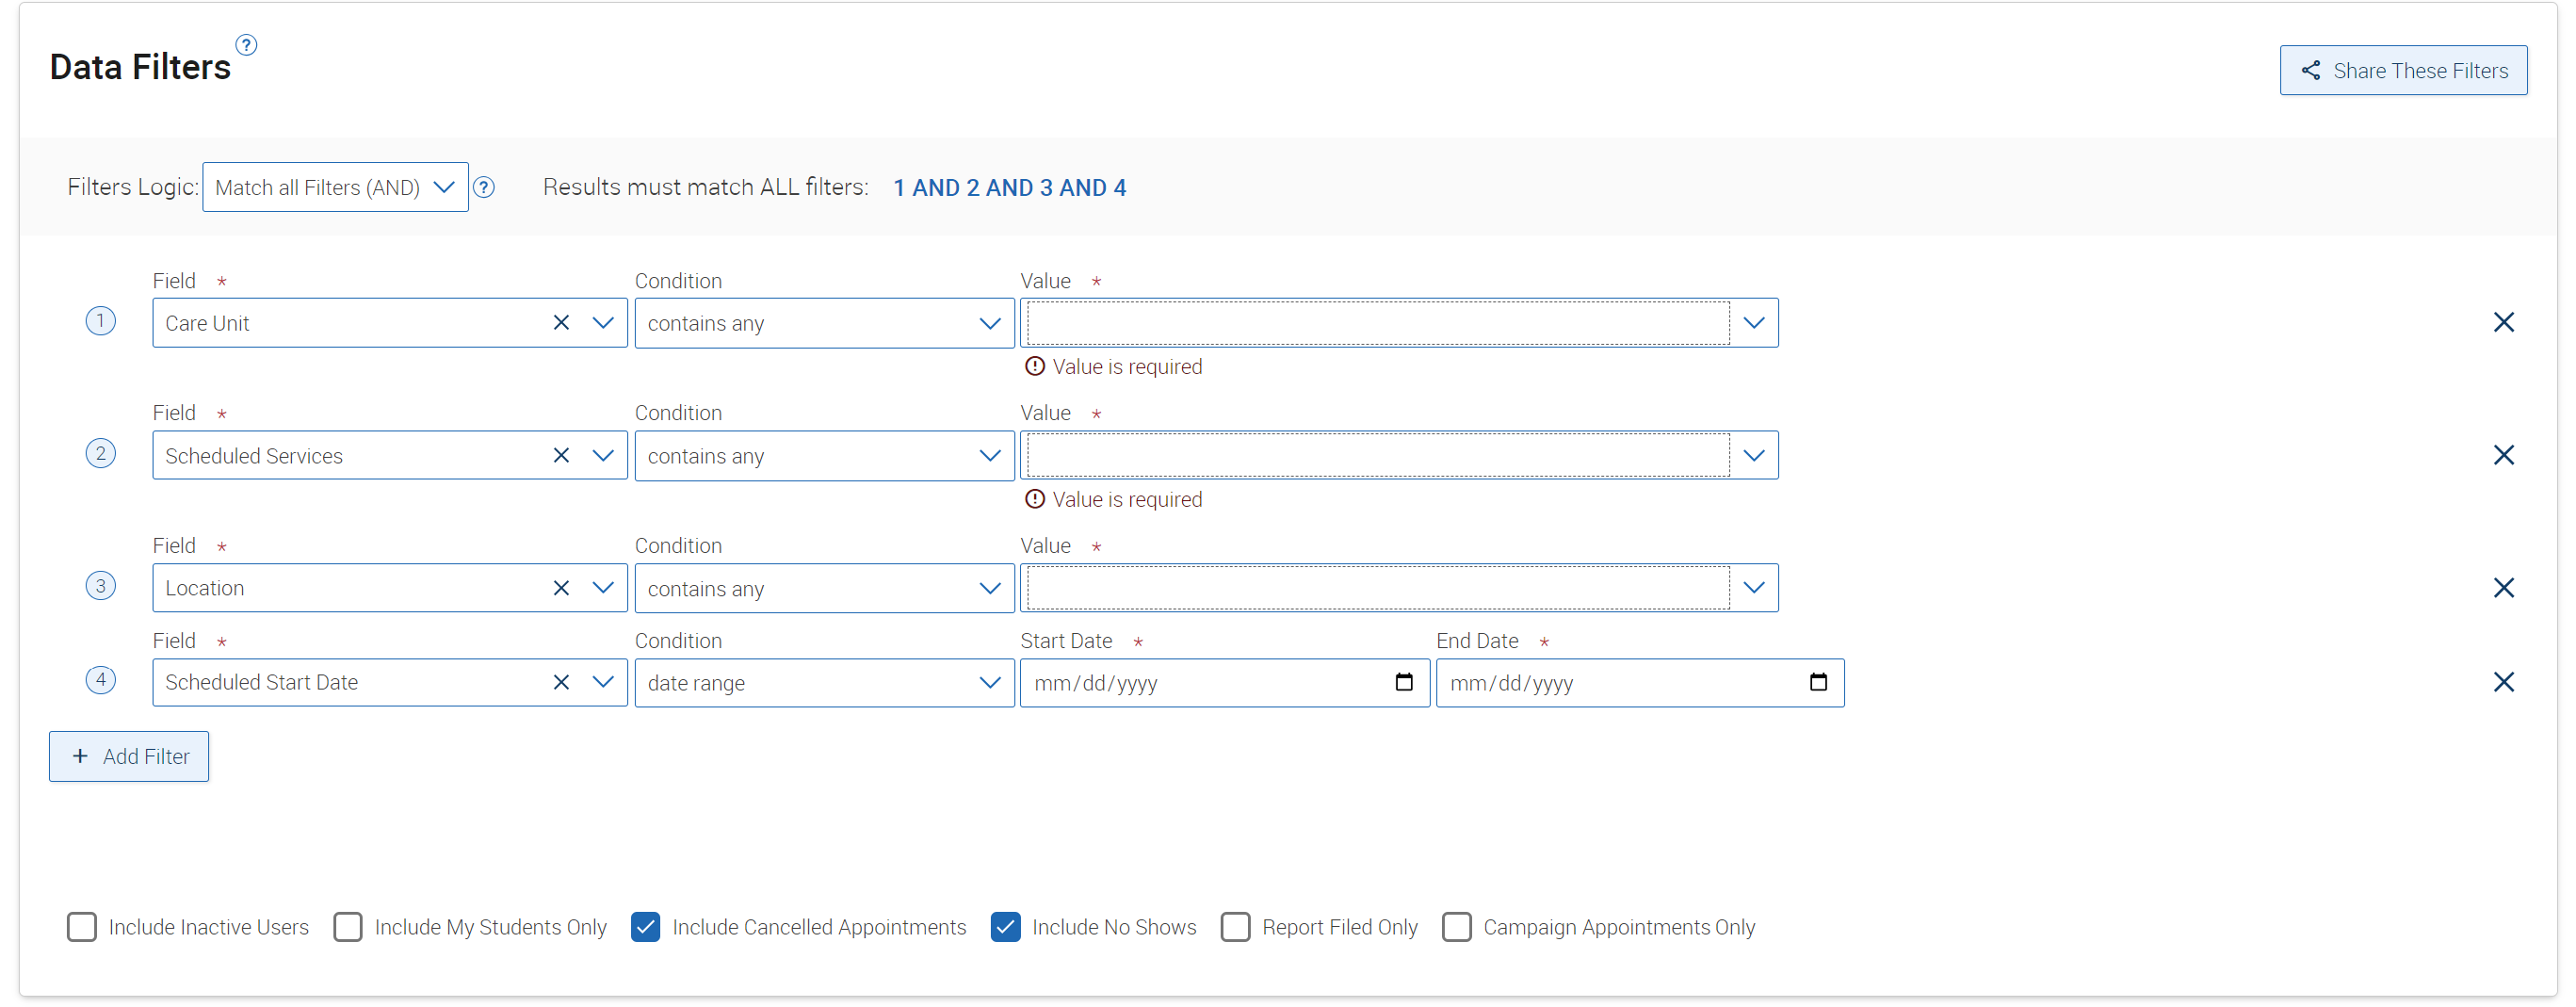
From here, you can enter your desired search criteria. I.e. your care unit, location and date range. ou also have the ability to filter the results further by using Student Area of Study, Information, Performance Data or Term Data filters. Note that for the date range you should use "Scheduled Start Date". This allows you to look for focused groups of students that have had appointments in a certain location. Note that you can type into the "Field" to search for any field you'd like to filter by. Below is an example of how you can filter by care unit, location and service for a specific date range.
The Students report (also known as the Student Info report) can be used to create a document which includes a list of students as well as who their assigned advisors are. It also includes other demographic information about students such as race/ethnicity and gender.
For example filters that are pre-made and can be auto-filled into Navigate, first login to Navigate and then click HERE. Simply adjust the major, degree, and concentration, then hit Run Report.
How to Manually Create a Students Report by Major, Degree and Concentration
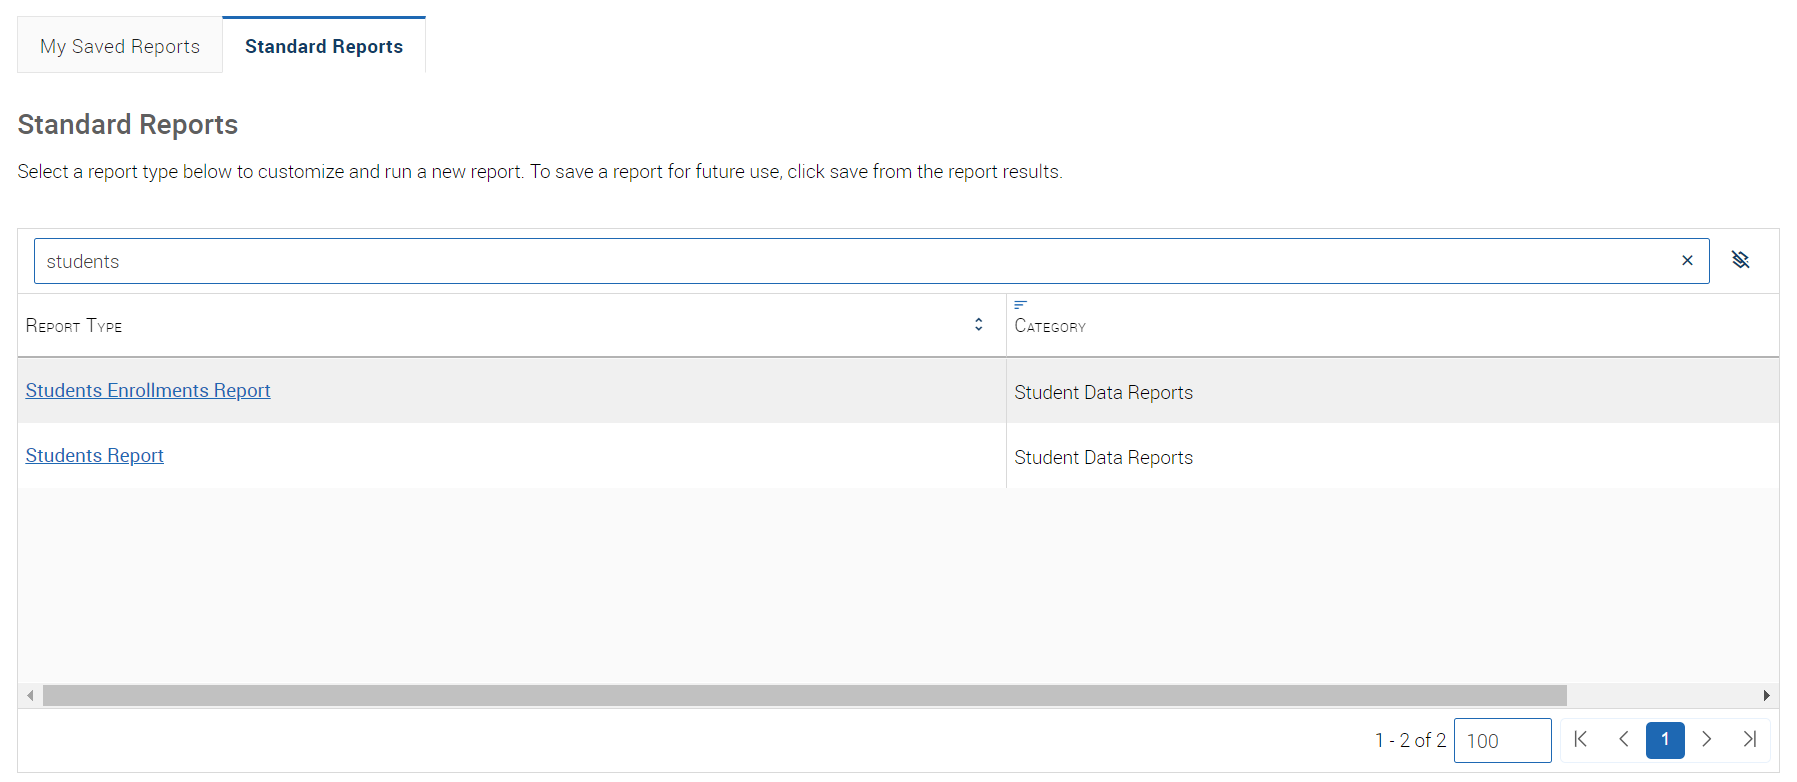
To create a Students report (previously called Student Info Report), simply navigate to the Reporting page by selecting the icon that looks like an excel sheet with a magnifying glass from the left-side toolbar. From here, under "Standard Reports" select "Students Report". You will then see the following screens.
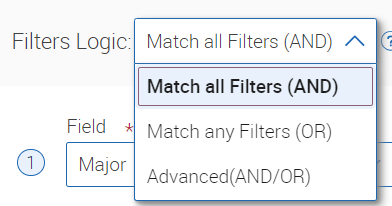
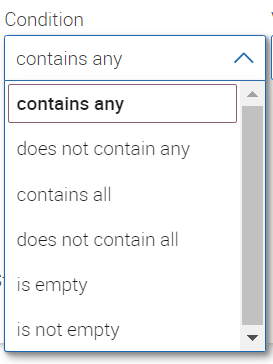
In general, this report runs very similar to an advanced search and all search criteria found in an advanced search are also found in this report. The Students report however has the ability to search for ANDs, ORs, contains, does not contain, is empty, is not empty and more. These advanced filters available in the Students report open up many more reporting possibilities that the advanced search does not have.
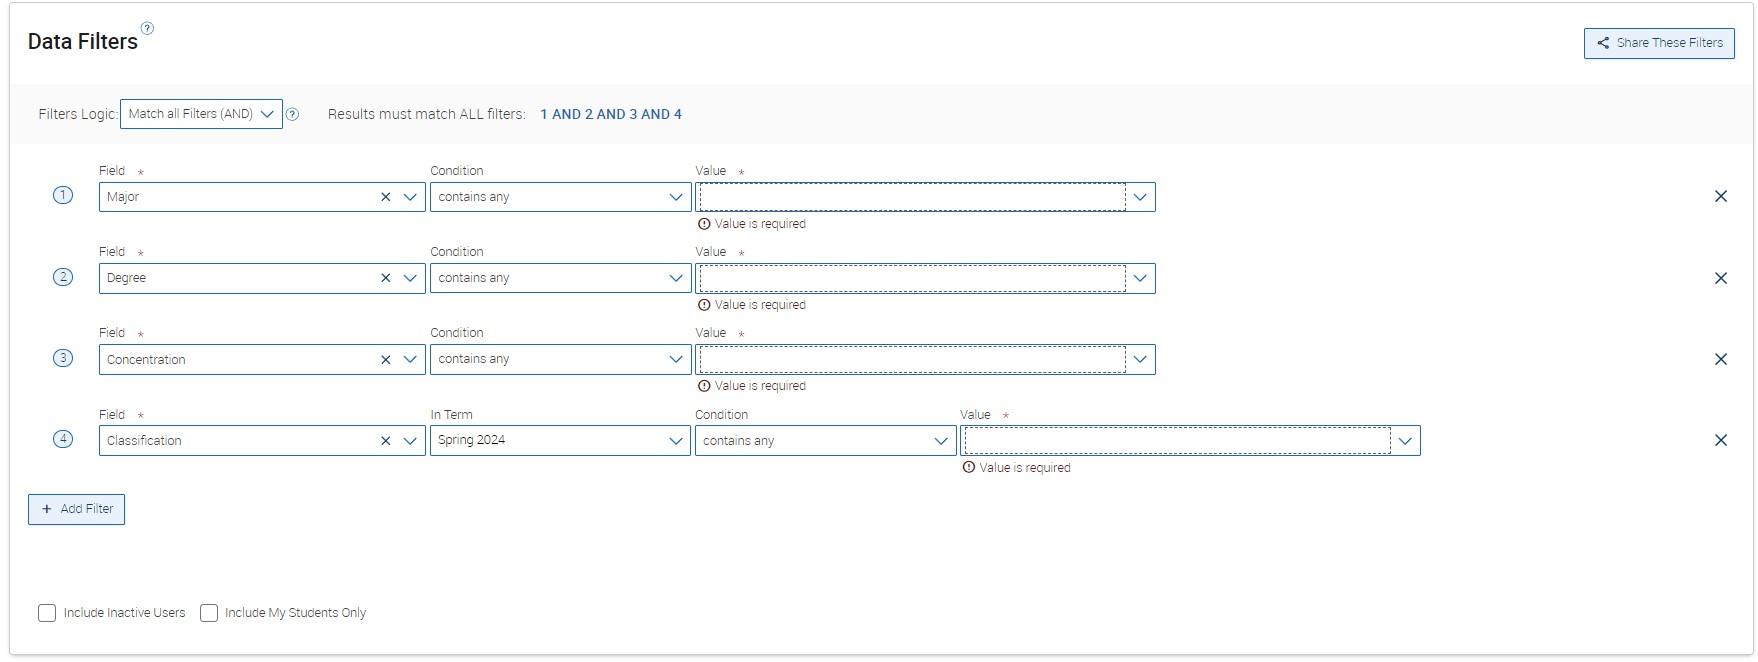
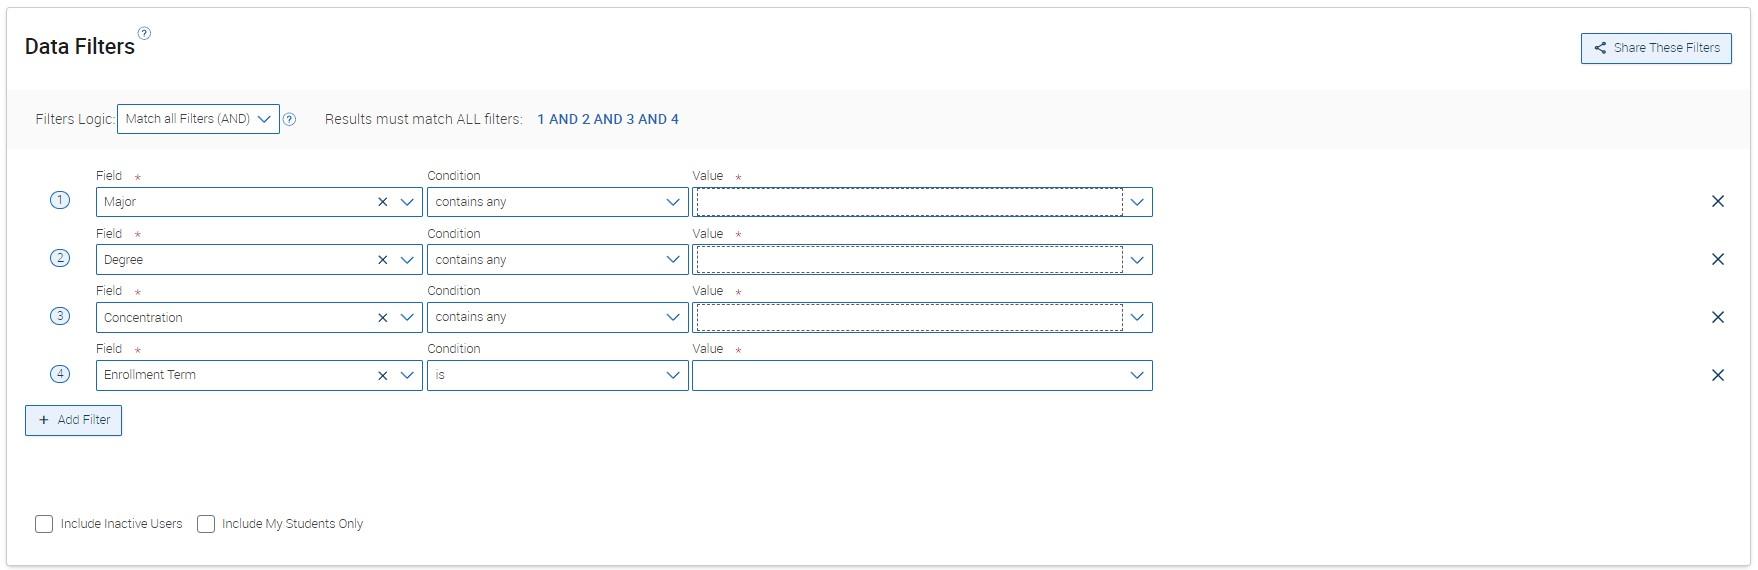
Next, you can specify the major(s), degree(s) and/or concentration(s) you'd like to run the report for. To ensure the students are current and enrolled, be sure to add field "Concentrations" for freshman, sophomore, junior and senior. This will ensure both UG students and enrollment in the selected term. Once you've added these, select "Run Report".
If you wish to create a report for all undergraduate students in a certain major to ensure that everyone has been assigned to an advisor, follow the steps below.
For example filters that are pre-made and can be auto-filled into Navigate, first login to Navigate and then click HERE. Simply adjust the "in term" to the current term, major, degree, and concentration, then hit Run Report.
How to Manually Create a Students Report for Undergraduate Assigned Advisors
To create a Students report (previously called Student Info Report), simply navigate to the Reporting page by selecting the icon that looks like an excel sheet with a magnifying glass from the left-side toolbar. From here, under "Standard Reports" select "Students Report". You will then see the following screens.
In general, this report runs very similar to an advanced search and all search criteria found in an advanced search are also found in this report. The Students report however has the ability to search for ANDs, ORs, contains, does not contain, is empty, is not empty and more. These advanced filters available in the Students report open up many more reporting possibilities that the advanced search does not have.
First, when checking who has been assigned an advisor, you will want to exclude all students who are enrolled in INQ 101 and HON 150 for the current term, because these students will be first year students that should not be assigned a major advisor yet. To do this add the following course filters.
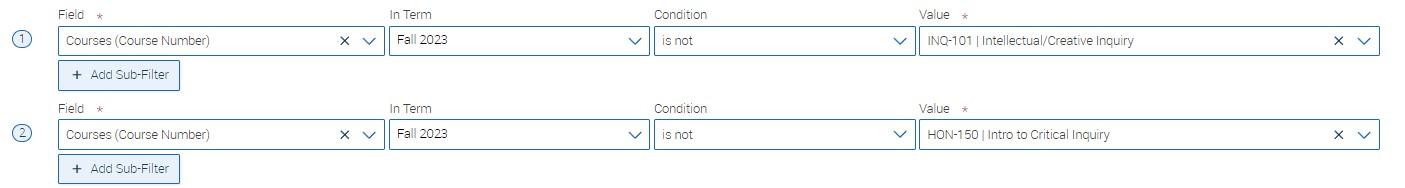
Notice the from and to term are the same (i.e. the "In Term" is the current term) and that the "Condition" is "is not".
Second, you will want to exclude current Early College students who are enrolled in your major(s) for the future term. They do not need to be assigned advisors, since they are not currently in the major. To do this, add the "Categories" field with condition "does not contain any" for value "Early College". This will ensure that Early College students who were admitted into your program for Spring are excluded from your search.

Third, you will want to exclude Graduate students. To do so add the "Classification" field for the current term with condition "contains any" for values "freshman", "sophomore", "junior", "senior". This will ensure UG students in addition to ensuring student enrollment in the selected term.

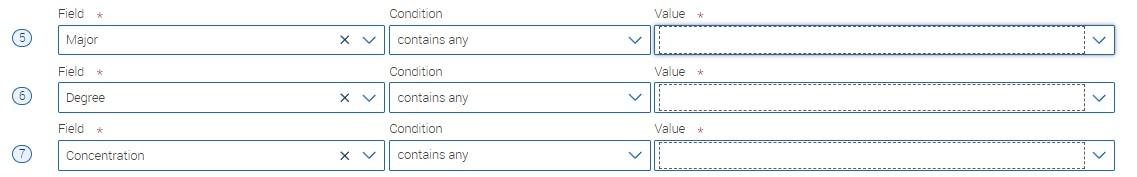
Fourth, you can filter specific major(s) you are interested in by adding the field "Major" for condition "contains any" and then listing any major(s) under the value. After selecting the desired major(s), select "Run Report" and a list of all students satisfying these requirements will appear.
You can then export the list to excel by selecting the download icon from the menu on the right-hand side of the report results.
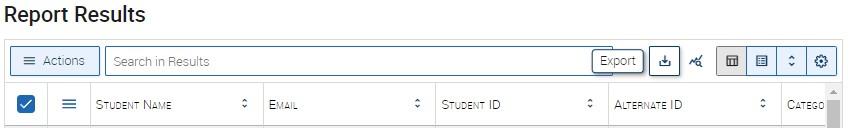
You will notice that this report includes columns of information that you do not need. When you go to export the data to excel, a pop-up will appear giving you the option to select only the columns that you are interested in before exporting. “Assigned Staff” is the column that lists each student’s assigned advisor.
Note: Students with secondary major advisors, or minor advisors will also have those advisors listed under "Assigned Staff".
The Student Enrollments report can be used to find a list of students along with their classes, professors, midterm/final grades, etc. for a specified semester.
For all midterm/final grades for a specific course, first sign into Navigate then click HERE for a pre-made template. Simply change the "Enrollment Course" and "Enrollment Term" and select Run Report.
For all midterm/final grades for a specific group of students by major/degree/concentration, first sign into Navigate then click HERE for a pre-made template. Simply change the enrollment term, major, degree and concentration to the group you are interested in finding final/midterm grades for and select Run Report.
How to Manually Create a Students Enrollments Report
To create a Student Enrollments report, simply navigate to the Reporting page by selecting the icon that looks like an excel sheet with a magnifying glass from the left-side toolbar. From here, under "Standard Reports" select "Students Enrollments Report". You will then see the following screens.
Once in the report, you can filter to see midterm/final grades for a specific course or for a specific group of students.
To see midterm/final grades for any student in a specific course, you can select your desired enrollment term and have the option to run the report for a specific course, to see all students and midterm/final grades for that course. To do this, utilize the field "Enrollment Term" and "Enrollment Course".
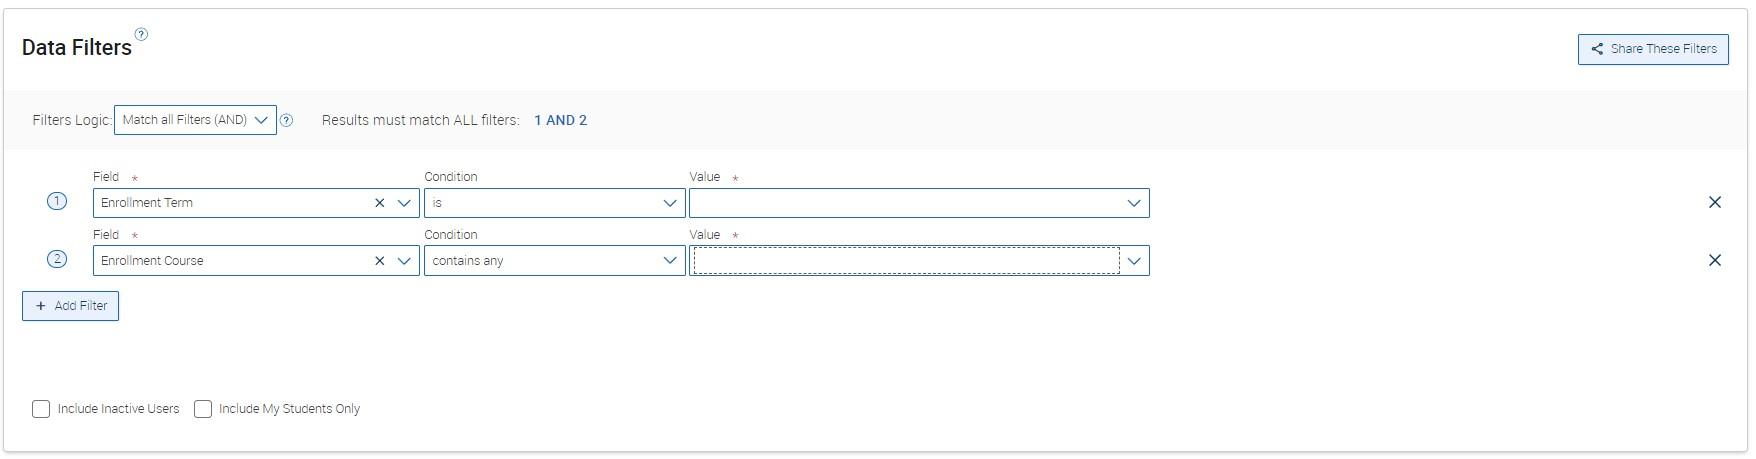
To see midterm/final grades for a certain group of students, you can use the field "Enrollment Term" to filter for current students. Then, you can filter further by major, degree, concentration, etc. See example below.
Note: This report will list each student the number of times that they are in classes. Meaning if a student was enrolled in 4 classes, their name would appear 4 times.
If you are in an office where you need to enter student worker availability within Navigate, you will need to follow these steps to do so. Before following these steps, note that you need to have special access to enter availability for your student workers. If you cannot do the below, it is most likely because you do not have the proper permissions.
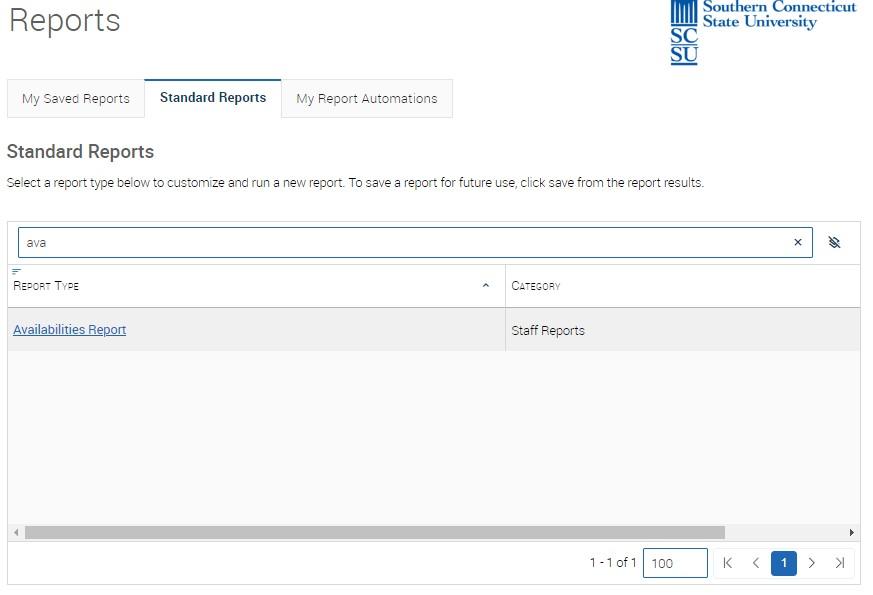
Step 1. Navigate to the Reporting page. The reporting icon is the one that looks like a spreadsheet with a magnifying glass on the left-side toolbar.
Step 2. Select the “Availabilities Report" under “Standard Reports”.
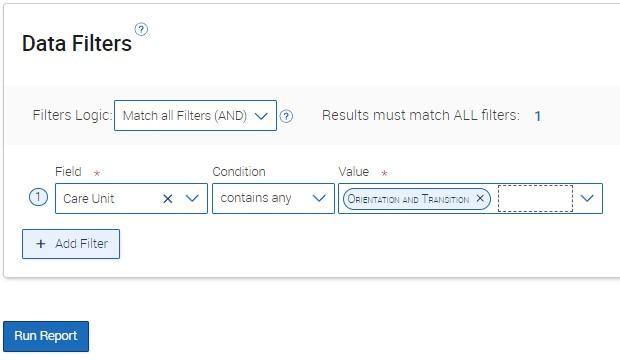
Step 3. Add the Care Unit that you are adding student worker availability to as the first "Field". In our example, we will use Orientation and Transition. Then, select "Run Report".
Step 4. Once you run the report, you will see a list of availabilities within the care unit.
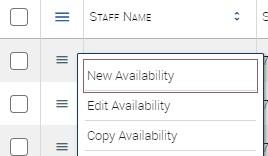
If adding availability to an existing student worker, select the three lines next to their name and then "New Availability".
If adding availability to a new student worker, select the three lines next to any availability and then "Copy Availability".
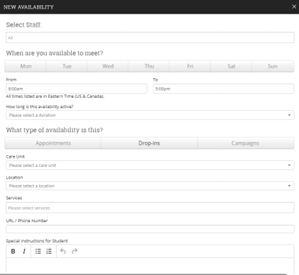
Step 5. Now, you will see the following box appear. If adding to a new student worker, under the “Select Staff” you can type the last name of the student worker you are adding time for and then select their name from the list. Once the student worker is selected, you add the availability the same way you would for an ordinary availability. To see details on how to add times, see the "Creating Availability" section here. Make sure you select the appropriate care unit location and service for your student workers.
Note: If there are times and days that are different, you will have to create multiple availabilities.